I’ve been experimenting around with performance tuning on my web server the last couple of days to try and work out some bizarre, high usage issues when (unfortunately) in reality none of my sites really garner that much traffic to warrant the spikes that I’ve been seeing.
Some of it is common sense stuff like troubleshooting slow-performing WordPress plugins – for example, apparently W3 Total Cache was dragging down my response times even though it wasn’t active at the time, which lead me to reinstalling and then actually setting it up correctly because I think I disabled it a few months ago out of sheer frustration.
I also made some tweaks to my Apache/PHP build, thus resulting in my having to rebuild no less than a dozen times last night each time I’d find a new option that I could only enable by rebuilding! So if for some reason you found one of my sites down last night, that would be the reason why… 😛
In the midst of all of this, I’ve also been trying a number of different web page speed tests to try and gauge my progress through the whole mess – Google PageSpeed Insights is usually my go-to for general tuning, but I also like WebPageTest.org because it gives me waterfall graphs of every single element that needs to be loaded, and I also recently discovered GTmetrix, which is cool because it will run several tests at once and gives you the option to see results for multiple sites side-by-side … something I normally have to do in separate windows.
Anywho, one of the views that I found interesting from WebPageTest.org is where they breakdown the actual requests and bytes coming from each individual domain because obviously the lower # for either of those stats, the faster your page will load. Below is what Just Laugh’s homepage looks like…
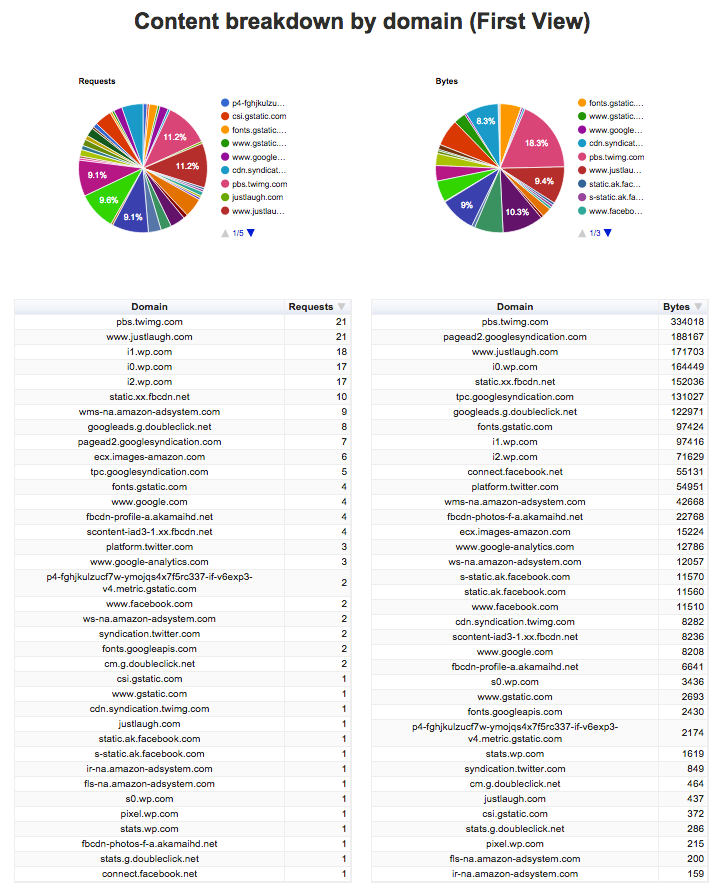
What’s interesting here is that really only a select few of these domains are related to actual content – primarily justlaugh.com and then wp.com because our images use WordPress.com’s CDN via the Jetpack plugin.
All of the Facebook hits are for the single Like box in the footer, and the same with Twitter.
We also have a single ad widget for Amazon, along with a couple of Google Adsense units, and then we use both Google Analytics and WordPress Jetpack for analytics.
So really, totals breakdown something like this…
- Content – 75 requests for 509k
- Social Media – 51 requests for 667k
- Advertising – 51 requests for 634k
- Analytics – 10 requests for 18k
- GRAND TOTAL – 187 requests for 1,828k
Now don’t get me wrong – there’s certainly value that comes from each of those other three sources otherwise I wouldn’t use them in the first place, but it still says something interesting about web content in our times when social media & advertising tie-ins together make up more than double the actual real content that a website has to offer to drive those other things in the first place! And before you say that it’s really kind of my fault that the breakdown is like this because I designed the site, I would add that really, Just Laugh is extraordinarily conservative with regards to advertising compared to other media sites that still use pop-ups and wraparounds and those god-awful Taboola ads that currently infect 80% of the web today.
Of course, the real exercise here is simply how to improve on these numbers, which is tough because most of these requests are still measured in milliseconds and many are done in parallel. The whole page currently takes right around 10 seconds to render, which in some ways seems terrible but in comparison with sites like CNN and The Onion it’s actually about right in the middle.
Could I shave off a couple of seconds by eliminating the Facebook and Twitter widgets, or possibly even the Amazon widget???
Possibly, but would the savings really be worthwhile in the bigger picture when gaining Facebook and Twitter followers is also a worthwhile goal???
Clearly I have no idea, but it’s always fun to have real, actual data to wade through to consider things like that!
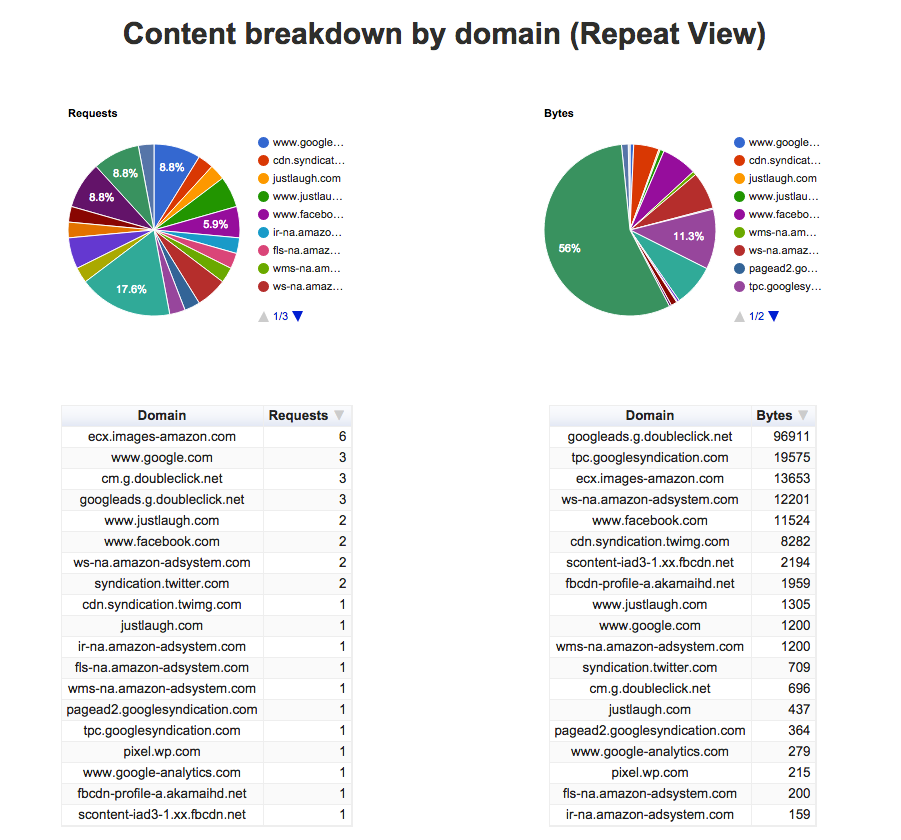
On the other hand, at least I can say for a fact that my caching is now working correctly because for repeat views, all of those 3rd party requests are pretty much the only things still getting reloaded… 😀